INTERNATIONAL FINANCE BANK

COMMUNITY REINVESTMENT ACT ("CRA") PUBLIC FILE
As of July 2025
For additional information, please contact our CRA Officer or Compliance Department at:
(305) 648-8895
PROPERTY OF INTERNATIONAL FINANCE BANK - DO NOT REMOVE
COMMUNITY REINVESTMENT ACT STATEMENT
International Finance Bank, its directors, officers and staff are fully committed to serving our community's needs for banking services.
The Bank's goal is to provide the largest possible of our service area's business and residents access to its wide variety of banking products and services.
We are also committed to playing a role in the betterment of our community (also referred to as its service area) by investing its efforts, assets, and resources to the best of our ability.
This commitment is demonstrated in the form of concerted efforts to improve the overall economic status of the community we serve.
The Bank's efforts on this endeavor is achieved by providing a broad range of banking deposit products, diversified loans, and other services to both our community's businesses and residents.
Since its inception in 1983, International Finance Bank has successfully offered its financial services and continues its outreach to its community and customer base.
International Finance Bank's service area currently includes the entirety of Miami-Dade County and the greater New York, NY
INTERNATIONAL FINANCE BANK
PRODUCTS AND RETAIL SERVICES OFFERED
PERSONAL BANKING
|
Depository Products |
Loans & Credit Plans |
|
Checking Account |
Residential Mortgage / Refinance |
|
Senior Citizen Checking Account |
Cash Secured Loan |
|
Money Market Account |
|
|
Interest Checking-NOW Account |
|
|
Certificate of Deposit |
|
|
Saving Account |
|
|
ICS/CDARS |
BUSINESS BANKING
|
Depository Accounts |
Loans & Credit Plans |
|
Business Checking Account |
Business Loans |
|
Business Money Market Account |
Leasehold & Capital improvement |
|
Certificate of Deposit |
Asset Based Loans |
|
IOTA Account |
Commercial Real Estate |
|
ICS/CDARS |
Letters of Credit |
ADDITIONAL RETAIL SERVICES
Fixed Life insurance / Annuities
1 (through IFB lnsurance LLC) 1
CONVENIENCES
|
Remote Deposit |
Online Banking |
|
ACH Origination |
Mobile Banking |
|
Bill Payment Services |
Mobile Deposit |
|
Cashier's Checks |
Zelle |
|
Debit Card |
Wire Transfer |
|
Acceptance of Direct Deposits |
Safe Deposit Box |
|
Drive-through location |
Bank by Mail |
|
Loan Production Office |
Aventura Loan Production Office 2980 NE 207 Street, #516 Aventura, Fl33180 MSA 33124 Census Tract 0001.34 Census Tract income Level Upper |
INTERNATIONAL FINANCE BANK
|
BRANCH LOCATIONS |
|
And Hours of Operation |
|
Douglas Banking Center New York Banking Center Mon to Thurs: 9am to 4:30pm (5pm on Fri) Mon to Friday: 9am to 4:30pm (5pm on Fri) (Previously located at 3663 SW 37th Avenue) DRIVE THROUGH AVAILABLE AT THIS LOCATION Mon to Fri (8am to 5pm) 777 SW 37th Avenue 623 Fifth Avenue Miami, Florida 33135 New York, New York 10022 MSA: 33124 Census Tract: 0055.03 MSA: 35614 Census Tract: 0102.00 Census Tract lncome Level: Middle Census Tract lncome Level: Unknown |
|
NIGHT DEPOSIT AVAILABLE AT DOUGLAS BANKING CENTER ATM NOT AVAILABLE {NO FEE ATM WITHDRAWALS AT CITIBANK BRANCHES IN THE US - UP TO FIVE ATM TRANSACTION FEE REIMBURSEMENTS AT OTHER ATMs PER MONTH) |
BRANCHES OPENED OR CLOSED
2023- NONE
2024- NONE
LOAN TO DEPOSIT RATIO
|
International Finance Bank CRA Report- Loan-to-Deposit Ratio |
|||
|
Date |
Ratio |
||
|
12/31/2024 |
95.86% |
||
|
9/30/2024 |
94.73% |
||
|
6/30/2024 |
94.77% |
||
|
3/31/2024 |
91.53% |
||
|
12/31/2023 |
92.73% |
||
|
9/30/2023 |
95.63% |
||
|
6/30/2023 |
97.02% |
||
|
3/31/2023 |
98.07% |
||
IFB has not received any comments from the public.
CRA Assessment Area
FFIEC Geocoding System - 2020 Census Miami, FL
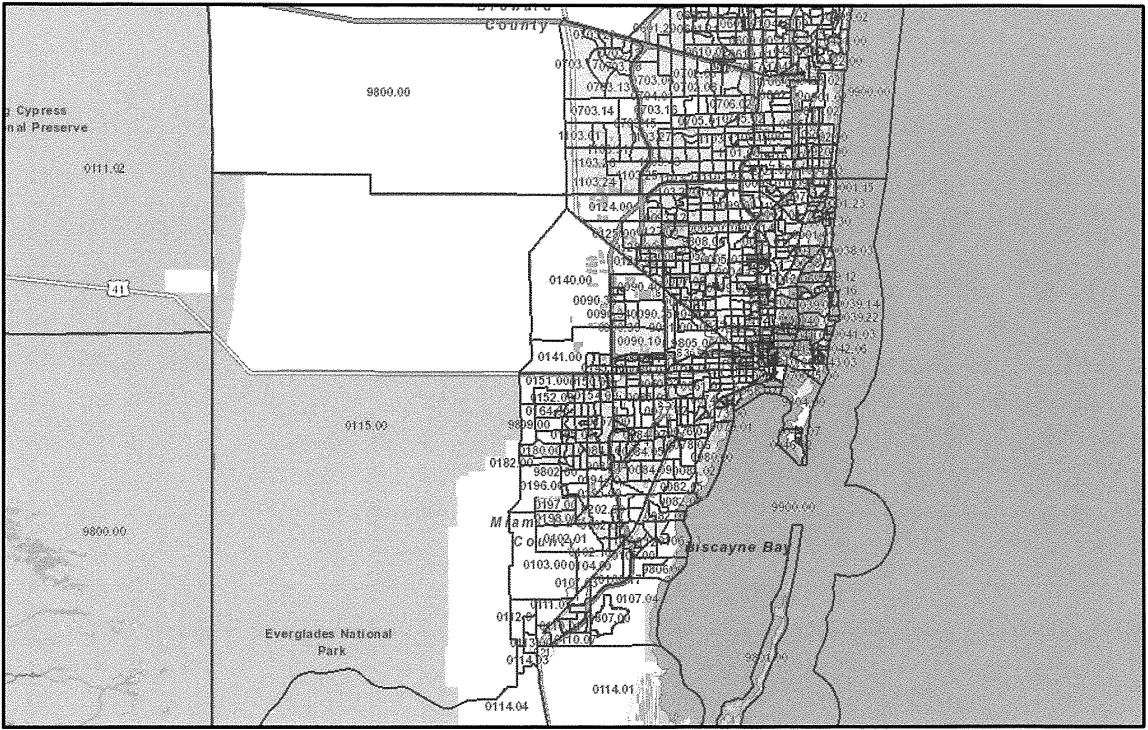
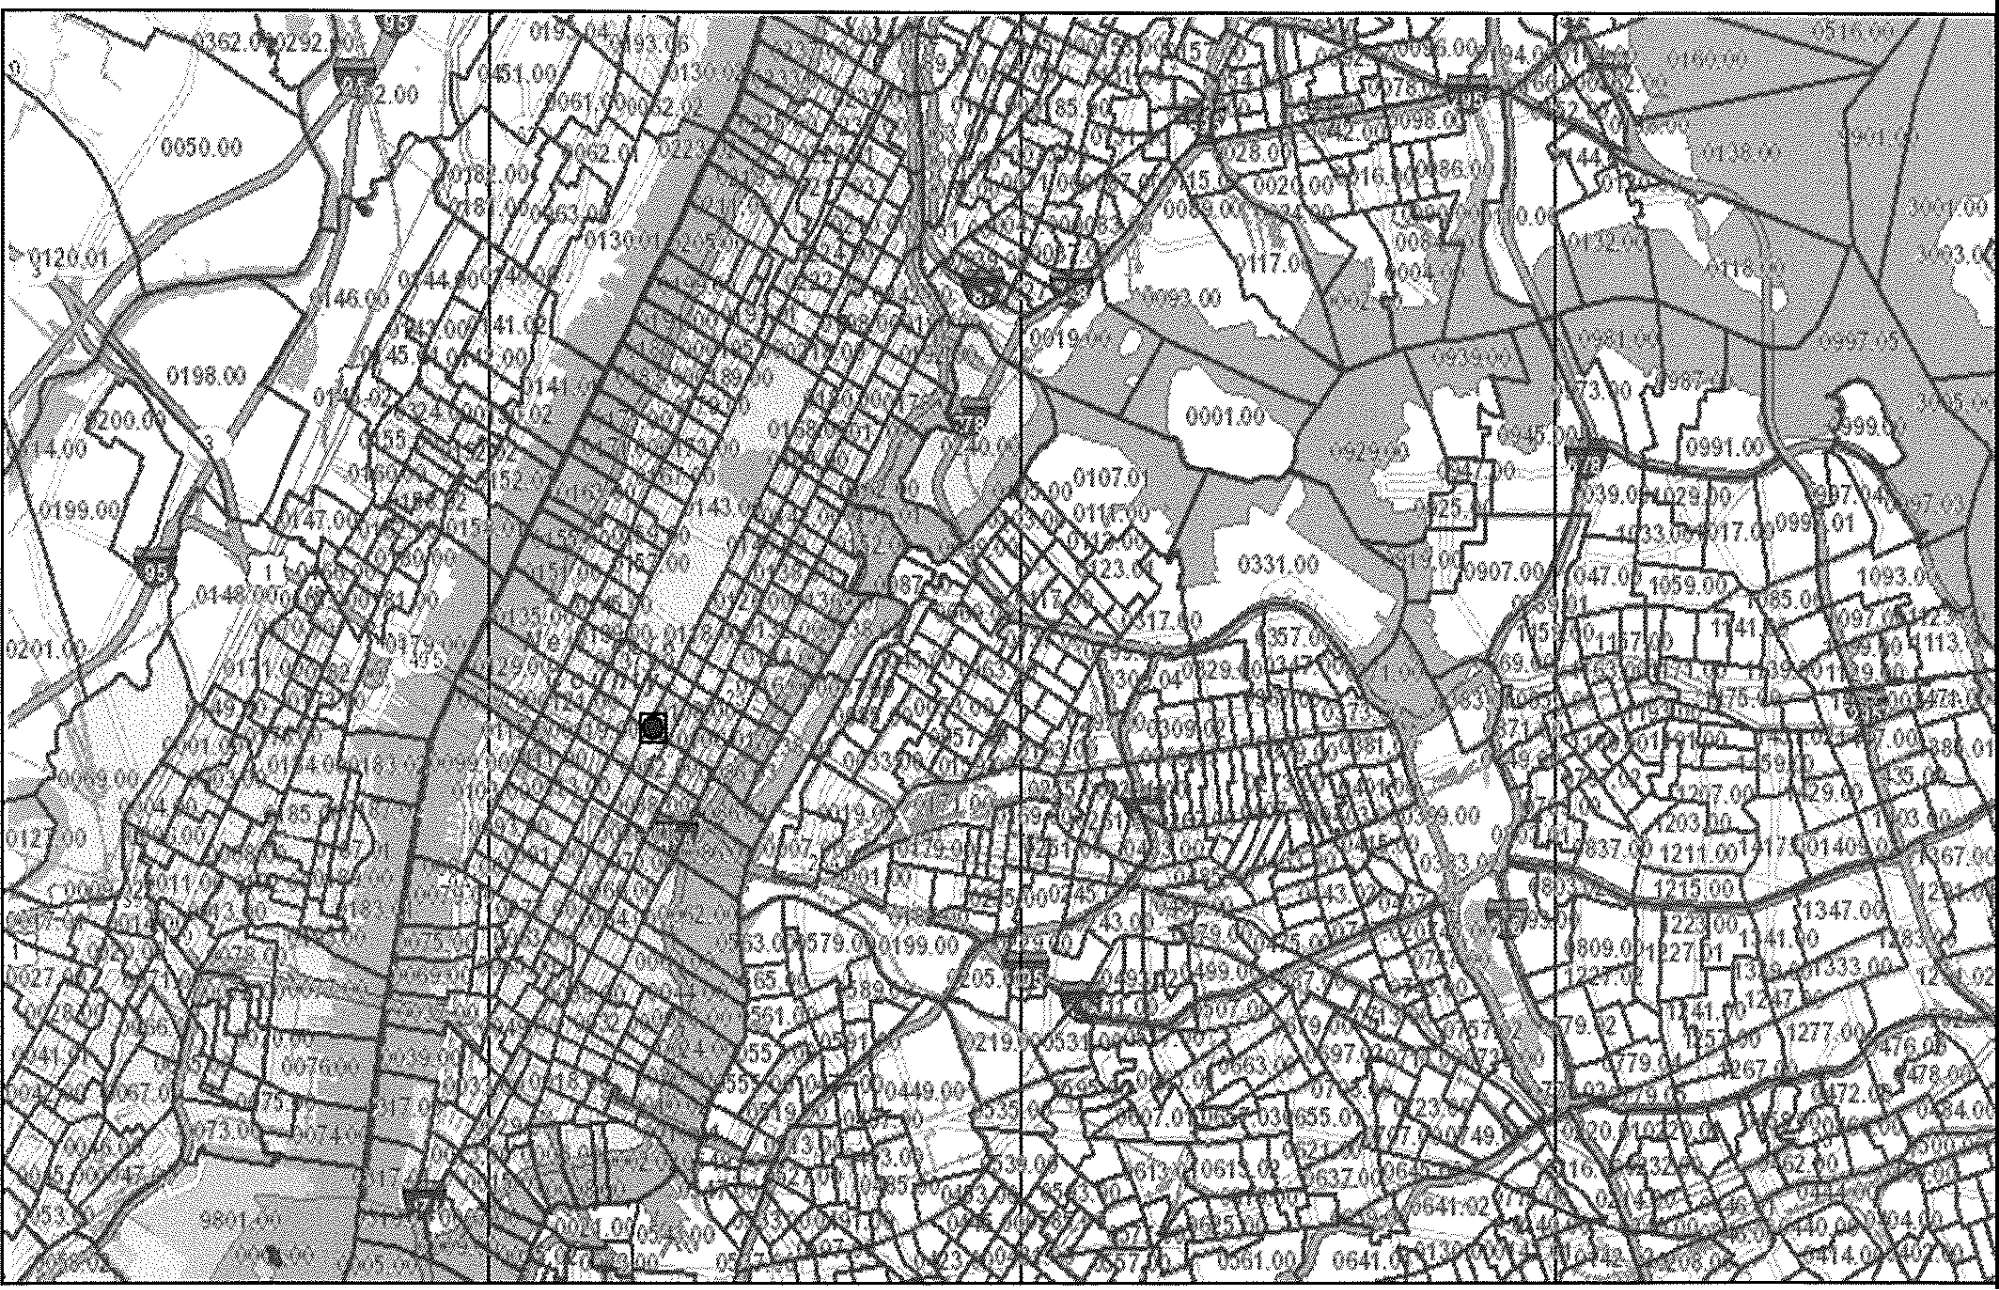
FFIEC Geocoding System - 2020 Census
New York, NY
HOME MORTGAGE DISCLOSURE ACT NOTICE
The HMDA data about our residential mortgage lending are available online for review. The data show geographic distribution of loans and applications; ethnicity, race, sex, age, and income of applicants and borrowers; and information about loan approvals and denials.
HMDA data for many other financial institutions are also available online.
For more information, visit the Consumer Financial Protection Bureau's website (www.consumerfinance.gov/hlnda).
International Finance Bank CRA Performance Evaluation
Attached
PUBLIC DISCLOSURE
September 30, 2021
COMMUNITY REINVESTMENT ACT PERFORMANCE EVALUATION
Intenational Finance Bank:
Certificate Number: 24823
777 SW 37th Avenue, Suite 700
Miami, Florida 33135
Federal Deposit Insurance Corporation Division of Depositor and Consumer Protection Atlanta Regional Office
1O 10th Street NE, Suite 800 Atlanta, Georgia 30309-3849
This document is an evaluation of this institution's record of meeting the credit needs of its entire community, including low- and moderate-income neighborhoods, consistent with safe and sound operation of the institution. This evaluation is not, nor should it be construed as, an assessment of the financial condition of this institution. The rating assigned to this institution does not represent an analysis, conclusion, or opinion of the federal financial supervisory agency concerning the safety and soundness of this financial institution.
INSTITUTION RATING
INSTITUTION'S CRA RATING: This institution is rated Satisfactory.
An institution in this group has a satisfactory record of helping to meet the credit needs of its assessment area, including low- and moderate-income neighborhoods, in a manner consistent with its resources and capabilities.
The Lending Test is rated Satisfactory.
- The loan-to-deposit ratio is reasonable given the institution's size, financial condition, and assessment area credit needs.
- A majority of the institution's loans were originated within the assessment areas.
- The geographic distribution of the loans reflects a reasonable dispersion throughout the assessment areas.
- The distribution of borrowers reflects a poor penetration among individuals of different income levels and businesses of different sizes.
- The institution has not received any Community Reinvestment Act (CRA)-related complaints since the previous evaluation. Therefore, this factor did not affect the Lending Test rating.
The Community Development Test is rated Satisfactory.
- The institution demonstrated an adequate responsiveness to the community development needs of its assessment areas. The institution met those needs through community development loans, qualified investments, and community development services. Examiners considered the institution's capacity and the need and availability of such opportunities for community development in the institution's assessment areas.
DESCRIPTION OF INSTITUTION
Background
International Finance Bank (IFB) is a state-chartered commercial bank headquartered in Miami, Florida. The bank has historically been a part of the Grupo Iberoamericano de Fomento SA, Madrid, Spain, which through common ownership and control, owns affiliated banks in Ecuador, Guatemala, Netherland Antilles, Peru, and Venezuela. However, on July 31, 2020, IFB Bancorp, Inc., Miami, Florida, was formed as a holding company and acquired IFB. The bank has two wholly-owned subsidiaries: IFB Insurance and IFB Wealth]. IFB received a Satisfactory CRA rating at the previous FDIC Performance Evaluation, dated September 27, 2018, based on Interagency Intermediate Small Institution Examination Procedures.
Operations
IFB currently operates two full-service offices, including its main office in Miami, Florida and an office in New York City, New York. In October 2018, IFB acquired international deposits totaling approximately $153 million from Modern Bank, a national banking association headquartered in New York City, New York. No loans were acquired as part of this transaction. IFB opened a full service office in New York City in October 2018 (in a census tract with an unknown income level). Additionally, the bank opened a loan production office in a middle-income census tract in Tampa, Florida, in June 2019, and in a moderate-income census tract in Aventura, Florida, in January 2020. In June 2020, IFB closed one of its full-service offices located in an upper-income census tract in Miami, Florida.
IFB offers a variety of products and services to meet the needs of its communities. Consumer credit products include installment loans, personal lines of credit, and one-to-four family residential mortgages. Commercial credit products include commercial real estate loans, equipment loans, construction loans, and commercial lines of credit. The bank also offers loans through the Small Business Administration (SBA) including the 504 loan program and the 7(a) Paycheck Protection Program (PPP). The bank originated 533 loans through the PPP totaling $39.8 million in 2020. In 2021, the bank originated 288 loans through the PPP totaling $28.4 million. The SBA guarantees these loans under the Coronavirus Aid, Relief, and Economic Security Act. The loans serve to retain jobs that would otherwise be lost due to business closures because of the COVID-19 national emergency. Deposit products include checking, savings, and money market accounts; certificates of deposit; and individual retirement accounts. Alternative banking services include internet banking, mobile banking (including mobile deposit), and telephone banking.
Ability and Capacity
IFB's assets totaled $926.9 million, as of June 30, 2021. Total loans and total deposits were
$713.7 million and $844.6 million, respectively. Since the previous evaluation, the loan portfolio composition has remained stable, and the bank's business focus continues to be commercial lending. Loans secured by one-to-four family residential properties declined from 30.8 percent of the bank's loan portfolio at the previous evaluation to 22.2 percent as of June 30, 2021. Conversely, loans secured by multifamily residential properties increased from 4.9 percent of the bank's loan portfolio at the previous evaluation to 8.1 percent as of June 30, 2021. The following table illustrates the composition of the bank's loan portfolio.
|
Loan Portfolio Distribution as of 6/30/2021 |
||
|
Loan Category |
$(000s) |
% |
|
Construction, Land Development, and Other Land Loans |
29,175 |
4.1 |
|
Secured by Farmland |
o |
o.o |
|
Secured by 1-4 Family Residential Properties |
158,782 |
22.2 |
|
Secured by Multifamily (5 or more) Residential! Properties |
57,947 |
8.1 |
|
Secured by Nonfarm Nonresidential Properties |
197,585 |
27.7 |
|
Total Real Estate Loans |
443,489 |
62.1 |
|
Commercial and Industrial Loans |
245,385 |
34.4 |
|
Agricultural Production and Other Loans to Farmers |
o |
O.O |
|
Consumer Loans |
20,258 |
2.8 |
|
Other Loans |
6,396 |
0.9 |
|
Lease Financing Receivables (net of unearned income) |
o |
o.o |
|
Less: Unearned Income |
(1,782) |
(0.2) |
|
Total Loans |
713,746 |
100.0 |
|
Source: Report of Condition and Income |
||
The bank provides for the credit needs of its communities in a manner consistent with its size, financial condition, resources, and local economic conditions. Examiners did not identify any financial, legal, or other impediments that affect the bank's ability to meet the assessment areas' credit needs
DESCRIPTION OF ASSESSMENT AREAS
The CRA requires each financial institution to define one or more assessment areas within which its performance will be evaluated. IFB operates within two rated areas, which include one assessment area in Florida and one assessment area in New York. The assessment area in Florida includes all of Miami-Dade County, which comprises the entire Miami-Miami Beach-Kendall, FL Metropolitan Division (MD). The assessment area in New York includes all of Bronx, Kings, New York, and Queens Counties, which comprise a portion of the New York-Jersey City-White Plains, NY-NJ MD. The assessment area in New York was added in October 2018 with the opening of the New York branch, and therefore is new since the previous evaluation. The assessment areas consist of whole census tracts and counties, and do not arbitrarily exclude low- or moderate-income areas.
Refer to the rated areas for additional information.
SCOPE OF EVALUATION
General Information
This evaluation covers the period from the previous evaluation dated September 27, 2018, to the current evaluation dated September 30, 2021. Examiners used Interagency Intermediate Small lnstitution Examination Procedures to evaluate IFB's CRA performance. As described in the Appendices, these procedures include a Lending Test and Community Development Test. Banks must achieve at least a satisfactory rating under each test to obtain an overall Satisfactory rating. This evaluation does not include any lending activity performed by affiliates.
Both assessment areas were reviewed using full-scope procedures. Examiners evaluate a bank's lending data, deposit activity, and number of branches to determine which rated area will receive the most weight in assigning the overall rating. As shown in the following table, the Miami-Miami Beach, Kendall, FL MD assessment area (State of Florida) comprises a significant majority of the loans reviewed (99.4 percent) and deposits (82.0 percent). Consequently, examiners gave considerably more weight to the bank's overall performance in the State of Florida.
|
Assessment Area Breakdown of Loans, Deposits, and Branches |
||||||
|
Assessment Area |
Loans (Reviewed) |
Deposits |
Branches |
|||
|
$(000s) |
% |
$(000s) |
% |
# |
% |
|
|
Miami-Miami Beach-Kendall, FL MD |
149,120 |
99.4 |
693 |
82.0 |
1 |
50.0 |
|
New York-Jersey City-White Plains, NY-NJ MD |
948 |
0.6 |
152 |
18.0 |
1 |
50.0 |
|
Total |
150,068 |
100.0 |
845 |
100.0 |
2 |
100.0 |
|
Source: Bank Records (Small Business and Home Mortgage Loans Originated 01/0l/2019-12/31/2020); FDIC Summary of Deposits (06/30/2021) |
||||||
Activities Reviewed
IFB's major product line is small business loans, followed by home mortgage loans. In reaching this conclusion, examiners considered the bank's business strategy as well as the number and dollar volume of loans originated during the evaluation period. Small business loans received greater weight in the overall Lending Test conclusions, as they constituted a majority of loan originations during the evaluation period and were the bank's primary business focus. Examiners did not evaluate small farm loans because the bank did not originate farm loans during the evaluation period.
For the Lending Test, examiners reviewed small business loans, as defined in the Glossary, for 2019 and 2020. In 2020, the bank originated 554 small business loans totaling $46.6 million. Examiners reviewed a sample of 63 small business loans totaling $7.8 million. Of the small business loans sampled in 2020, 56 loans, totaling $3.7 million, were PPP loans. Due to the large volume of PPP loans and the fact that business revenue information was not collected for these loans, examiners determined that the data was not representative of the entire evaluation period. Therefore, 2019 small business lending was also reviewed. In 2019, the bank originated 45 small business loans totaling $19.3 million. Examiners reviewed the universe of 2019 small business loans. As a non-reporter, aggregate small business lending data is not used for comparison purposes. Therefore, examiners compared the bank's 2019 and 2020 small business lending performance to 2019 and 2020 Dunn & Bradstreet (D&B) business demographic data.
Examiners reviewed the universe of home mortgage loans originated in 2019 and 2020 to draw conclusions about the bank's home mortgage lending performance. Examiners reviewed the universe of home mortgage loan originations reported pursuant to the Home Mortgage Disclosure Act (HMDA) in 2019, which consisted of 52 home mortgage loans totaling $55.8 million.
Although the bank was nota HMDA reporter in 2020, examiners reviewed the universe of home mortgage loan originations, consisting of 60 loans totaling $67.2 million. Examiners compared the bank's 2019 and 2020 home mortgage lending performance to demographic data, including 2015
American Community Survey (ACS) Census data. Additionally, examiners compared the bank's 2019 home mortgage lending performance to aggregate data of HMDA reporters.
For the Lending Test, examiners reviewed the number and dollar volume of small business and home mortgage loans. While the tables throughout this evaluation present both the number and dollar volume of loans, examiners emphasized performance by number of loans, as the number of loans is a better indicator of the number of businesses and individuals served.
For the Community Development Test, examiners drew conclusions based on the data that bank management provided for community development loans, qualified investments, and community development services since the previous evaluation, dated September 27, 2018.
CONCLUSIONS ON PERFORMANCE CRITERIA
LENDING TEST
Overall, IFB demonstrated satisfactory performance under the Lending Test. This rating is supported by a reasonable loan-to-deposit ratio; a majority of the loans reviewed were originated within the assessment areas; and a reasonable geographic distribution of home mortgage and small business loans in the Miami-Miami Beach-Kendall, FL MD assessment area. Examiners could not form reasonable conclusions regarding the IFB's geographic distribution of loans and the distribution of borrowers among individuals of different income levels and businesses of different sizes because of the low volume of home mortgage and small business loans originated in the New York-Jersey City-White Plains, NY-NJ MD assessment area. No CRA-related complaints were received since the previous evaluation.
Loan-to-Deposit Ratio
The bank's net loan-to-deposit (NLTD) ratio is reasonable given the institution's size, financial condition, and assessment area credit needs. The NLTD ratio for the previous 12 quarters averaged
88.5 percent. This ratio is calculated on a net basis, excluding the loan loss reserves and unearned income. Since the previous evaluation, the bank's NLTD ratio has ranged from a low of 81.3 percent on December 31, 2018, to a high of 102.0 percent on September 30, 2018. Toe NLTD ratio has fluctuated, with a moderately decreasing trend noted from March 31, 2020, through March 31, 2021. The following table presents the average NLTD ratio for IFB as well as for comparable institutions based on asset size, geographic location, and lending focus. IFB maintained an average NLTD ratio that was slightly higher than the comparable institutions.
|
Loan-to-Deposit Ratio Comparison |
||
|
Bank Name and Location |
Total Assets as of 6/30/2021 $(000s) |
Average NLTD Ratio (%) |
|
International Finance Bank, Miami, FL |
926,899 |
88.5 |
|
The First National Bank of South Miami, South Miami, FL |
958,402 |
82.1 |
|
Apollo Bank, Miami, FL |
946,194 |
76.4 |
|
Pacific National Bank, Miami, FL |
844,558 |
83.9 |
|
Source: Reports of Income and Candition 9/30/2018 through 6/30/2021 |
||
Assessment Area Concentration
A majority of loans by number and dollar volume were originated within the institution's assessment areas. Refer to the following table for details.
|
Lending lnside and Outside of the Assessment Areas |
||||||||||
|
Loan Category |
Number of Loans |
Total # |
Dollar Amount of Loans $(000s) |
Total $(000s) |
||||||
|
Inside |
Outside |
Inside |
Outside |
|||||||
|
# |
% |
# |
% |
$ |
% |
$ |
% |
|||
|
Home Mortgage |
||||||||||
|
2019 |
49 |
94.2 |
3 |
5.8 |
52 |
53,702 |
96.3 |
2,048 |
3.7 |
55,750 |
|
2020 |
38 |
63.3 |
22 |
36.7 |
60 |
36,600 |
54.4 |
30,618 |
45.6 |
67,218 |
|
Subtotal |
87 |
77.7 |
25 |
22.3 |
112 |
90,302 |
73.4 |
32,666 |
26.6 |
122,968 |
|
Small Business |
||||||||||
|
2019 |
31 |
68.9 |
14 |
31.1 |
45 |
11,844 |
61.4 |
7,439 |
38.6 |
19,283 |
|
2020 |
57 |
90.5 |
6 |
9.5 |
63 |
7,419 |
94.9 |
398 |
5.1 |
7,817 |
|
Subtotal |
88 |
81.5 |
20 |
18.5 |
108 |
19,263 |
71.1 |
7,837 |
28.9 |
27,100 |
|
Total |
175 |
79.5 |
45 |
20.5 |
220 |
109,565 |
73.0 |
40,503 |
27.0 |
150,068 |
|
Source: J/1/2019-12/31/2020 Bank Data. Due to rounding, totals may not equal 100.0 |
||||||||||
Geographic Distribution
Overall, the geographic distribution of the loans reflects reasonable dispersion throughout the assessment areas. This conclusion is supported by reasonable dispersion of the home mortgage and small business loans in the State of Florida. Examiners could not form meaningful conclusions on the bank's performance in the State of New York because of the low volume of home mortgage and small business loans originated during the evaluation period.
Borrower Profile
Overall, the distribution of borrowers reflects poor penetration among individuals of different income levels and businesses of different sizes. This conclusion is based on an overall poor penetration of home mortgage and small business loans in the State of Florida. Examiners could not form meaningful conclusions on the bank's performance in the State of New York because of the low volume of home mortgage and small business loans originated during the evaluation period.
Response to Complaints
The institution has not received any CRA-related complaints since the previous evaluation. Therefore, this factor <lid not affect the Lending Test rating.
COMMUNITY DEVELOPMENT TEST
The institution's community development performance demonstrates adequate responsiveness to community development needs in its assessment areas, considering the institution's capacity and the need an availability of such opportunities for community development in the institution's assessment area. IFB met those needs through community development loans, qualified
investments, and community development services. The bank's overall community development test performance was comparable to similarly situated banks and consistent between each rated area. The following table illustrates the bank's community development activities during the review period.
|
Community Development Activities (Ali Activities) |
||||||||
|
Assessment Area |
Activity Type |
Totals |
||||||
|
Loans |
Investments |
Services |
||||||
|
# |
$(000s) |
# |
$(000s) |
# |
$(000s) |
# |
$(000s) |
|
|
Miami-Miami Beach-Kendall, FL MD |
18 |
34,655 |
25 |
3,181 |
22 |
- |
65 |
37,836 |
|
New York-Jersey City-White Plains, NY-NJMD |
19 |
2,645 |
9 |
1,100 |
1 |
- |
29 |
3,745 |
|
Statewide Activities (Florida) |
1 |
2,918 |
2 |
122 |
o |
- |
3 |
3,040 |
|
Nationwide Activities |
o |
o |
o |
o |
o |
- |
o |
o |
|
Totals |
38 |
40,218 |
36 |
4,403 |
23 |
- |
97 |
44,621 |
|
Source: Bank Records |
||||||||
Community Development Loans
IFB originated or purchased 38 community development loans totaling $40.2 million during the evaluation period as detailed in the following table. The dollar amount of the community development loans equates to 5.2 percent of average total assets and 6.5 percent of average total loans, as of June 30, 2021, and is responsive to the assessment areas' community development needs. The level of community development loans increased from the prior evaluation, during which IFD originated 11 community development loans, totaling $11.1 million. This represented 3.4 percent of average total assets and 2.7 percent of average total loans.
By number, 2.6 percent supported economic development, 36.9 percent supported revitalization or stabilization, and 60.5 percent supported affordable housing. The community development loans include one loan outside the bank's assessment areas, but in a greater regional area, totaling $2.9 million, to a business that provides affordable rental housing in low- and moderate-income census tracts to low- and moderate-income individuals and families. The following table reflects the bank's overall community development lending activity, by year and purpose. Refer to the rated areas for additional details on community development loans.
|
Community Development Lending |
||||||||||
|
Activity Year |
Affordable Housing |
Community Services |
Economic Development |
Revitalize or Stabilize |
Totals |
|||||
|
# |
$(000s) |
# |
$(000s) |
# |
$(000s) |
# |
$(000s) |
# |
$(000s) |
|
|
9/28/2018- 12/31/2018 |
2 |
1,870 |
o |
o |
o |
o |
o |
o |
2 |
1,870 |
|
2019 |
l |
325 |
o |
o |
o |
o |
1 |
3,075 |
2 |
3,400 |
|
2020 |
9 |
14,855 |
o |
o |
1 |
12,600 |
12 |
2,055 |
22 |
29,510 |
|
1/1/2021- 9/30/2021 |
11 |
4,755 |
o |
o |
o |
o |
1 |
683 |
12 |
5,438 |
|
Total |
23 |
21,805 |
o |
o |
1 |
12,600 |
14 |
5,813 |
38 |
40,218 |
|
Source: Bank Data |
||||||||||
Qualified Investments
During the evaluation period, IFB made 36 qualified investments and donations, totaling $4.4 million, representing 0.6 percent of average total assets and 9.0 percent of average total securities as of June 30, 2021. The bank's qualified investments were responsive to the assessment areas' community development needs. IFB made 17 qualified donations, totaling $163,725, benefitting organizations supporting community services, affordable housing, and economic development.
These organizations represent vital social services, especially for low- and moderate-income children and individuals, provide for affordable housing, and support economic development. The qualified donations include two donations, totaling $122,319, to an organization that funds education scholarships throughout the State of Florida for economically-disadvantaged children (kindergarten through the 12th grade). The following table reflects the bank's overall qualified investments activity, by year and purpose. Refer to the rated areas for additional details on qualified investments.
|
Qualified Investments |
||||||||||
|
Activity Year |
Affordable Housing |
Community Services |
Economic Development |
Revitalize or Stabilize |
Totals |
|||||
|
# |
$(000s) |
# |
$(000s) |
# |
$(000s) |
# |
$(000s) |
# |
$(000s) |
|
|
Prior Period |
o |
o |
o |
o |
o |
o |
o |
o |
o |
o |
|
09/28/2018-12/3 l/2018 |
1 |
600 |
o |
o |
1 |
249 |
o |
o |
2 |
849 |
|
2019 |
6 |
792 |
o |
o |
3 |
749 |
o |
o |
9 |
1,541 |
|
2020 |
3 |
600 |
o |
o |
3 |
749 |
o |
o |
6 |
1,349 |
|
YTD 2021 |
2 |
500 |
o |
o |
o |
o |
o |
o |
2 |
500 |
|
Subtotal |
12 |
2,492 |
o |
o |
7 |
1,747 |
o |
o |
19 |
4,239 |
|
Grants & Donations |
1 |
1 |
15 |
158 |
1 |
5 |
o |
o |
17 |
164 |
|
Total |
13 |
2,493 |
15 |
158 |
8 |
1,752 |
o |
o |
36 |
4,403 |
|
Source: Bank Data |
||||||||||
Community Development Services
During the evaluation period, IFB's Board members and employees provided 23 community development services to 11 organizations. The bank's community development services were responsive to the assessment areas' community development needs. The organizations benefitted the rated areas by providing essential community services to low- and moderate-income individuals and by supporting economic development. The following table illustrates the bank's community development services by year and purpose. Refer to the rated areas for additional details on community development services.
|
Community Development Services |
|||||
|
Activity Year |
Affordable Housing: |
Community Services |
Economic Development |
Revitalize or Stabilize |
Totals |
|
# |
# |
# |
# |
# |
|
|
9/28/2018 -12/31/2018 |
o |
o |
o |
o |
o |
|
2019 |
o |
8 |
1 |
o |
9 |
|
2020 |
o |
7 |
1 |
o |
8 |
|
l/1/2021-9/30/202l |
o |
5 |
1 |
o |
6 |
|
Totals |
o |
20 |
3 |
o |
23 |
|
Source: Bank Data |
|||||
DISCRIMINATORY OR OTHER ILLEGAL CREDIT PRACTICES REVIEW
The bank's compliance with the laws relating to discrimination and other illegal credit practices was reviewed, including the Fair Housing Act and the Equal Credit Opportunity Act. Examiners did not identify any discriminatory or other illegal credit practices.
STATE OF FLORIDA
CRA RATING FOR FLORIDA: SATISFACTORY
The Lending Test is rated: Satisfactory
The Community Development Test is rated: Satisfactory
DESCRIPTION OF INSTITUTION'S OPERATIONS IN FLORIDA
IFB operates one of its two full-service branches in the Miami-Miami Beach-Kendall, FL MD assessment area (State of Florida). The assessment area includes all 519 census tracts in Miami-Dade County, which comprises the entire Miami-Miami Beach-Kendall, FL MD. The assessment area remains unchanged from the previous evaluation.
Economic and Demographic Data
The following table illustrates select demographic characteristics of the assessment area based on the 2015 ACS Census data and the 2020 D&B data.
|
Demographic Information of the Assessment Area |
||||||
|
Demographic Characteristics |
# |
Low % of # |
Moderate % of H |
Middle % of # |
Upper % of # |
NA* % o f# |
|
Geographies (Census Tracts) |
519 |
5.8 |
27.7 |
28.9 |
34.1 |
3.5 |
|
Population by Geography |
2,639,042 |
5.5 |
29.7 |
30.9 |
33.2 |
0.7 |
|
Housing Units by Geography |
998,833 |
5.3 |
27.5 |
29.3 |
37.2 |
0.6 |
|
Owner-Occupied Units by Geography |
452,826 |
2.0 |
21.4 |
31.9 |
44.4 |
0.2 |
|
Occupied Rental Units by Geography |
389,327 |
9.6 |
37.8 |
28.2 |
23.5 |
0.8 |
|
Vacant Units by Geography |
156,680 |
4.3 |
19.4 |
24.6 |
50.4 |
1.3 |
|
Businesses by Geography |
533,780 |
3.1 |
20.8 |
25.9 |
47.8 |
2.4 |
|
Farms by Geography |
5,633 |
3.5 |
22.8 |
27.1 |
45.8 |
0.8 |
|
Family Distribution by Income Level |
572,388 |
24.0 |
16.6 |
16.9 |
42.5 |
o.o |
|
Household Distribution by Income Level |
842,153 |
26.1 |
15.1 |
15.9 |
42.9 |
O.O |
|
Median Family Income MSA - 33124 Miami-Miami Beach-Kendall, FL |
$49,264 |
Median Housing Value |
$244,010 |
|||
|
Median Gross Rent |
$1,155 |
|||||
|
Families Below Poverty Leve! |
16.9% |
|||||
|
Source: 2015 ACS Census and 2020 D&B Data Due to rounding, totals may not equal 1OO.0% (*) The NA category consists of geographies that have not been assigned an income classification. |
||||||
The Geographic Distribution criterion compares home mortgage loans to the distribution of owner occupied housing units and small business loans to the percentage of businesses located in low-, moderate-, middle-, and upper-income census tracts. As illustrated in the previous table, only 2.0
percent of owner-occupied housing units and 3.1 percent of businesses are located in low-income census tracts. This data indicates limited owner-occupied home mortgage and small business lending opportunities in low-income census tracts. Further, 16.9 percent of families have incomes below the federal poverty level, which poses a challenge for home mortgage lending to low-income families, as these families likely face difficulty in qualifying for a home mortgage loan.
Examiners used Federal Financial Institutions Examination Council (FFIEC)-updated median family income figures to analyze home mortgage lending under the Borrower Profile criterion. The following table reflects low-, moderate-, middle-, and upper-income categories in the assessment area.
|
Median Family Income Ranges |
||||
|
Median Family Incomes |
Low <50% |
Moderate 50% to <80% |
Middle 80% to <120% |
Upper 2:120% |
|
2019 ($54,900) |
<$27,450 |
$27,450 to <$43,920 |
$43,920 to <$65,880 |
2:$65,880 |
|
2020 ($59,100) |
<$29,550 |
$29,550 to <$47,280 |
$47,280 to <$70,920 |
2:$70,920 |
|
Source: FFIEC |
||||
The analysis of small business loans under the Borrower Profile criterion compares the distribution of businesses by gross annual revenue level. According to 2020 D&B data, 533,780 businesses operated in the assessment area. Of these businesses, 93.3 percent had gross annual revenues of $1.0 million or less, 2.7 percent had gross annual revenues of more than $1.0 million, and 4.0 percent of businesses <lid not report revenues.
According to Moody's Analytics, the assessment area's largest industries include education and health services at 16.6 percent, professional and business services at 15.5 percent, and retail trade at 11.7 percent. Moody's Analytics reports that the assessment area's major employers include Publix Supermarkets (39,240 employees), Baptist Health South Florida (23,000 employees), and American Airlines (13,500 employees).
Data obtained from the U.S. Bureau of Labor Statistics indicates significant changes in the unemployment rate during the evaluation period. As illustrated in the following table, the unemployment rate in the United States, State of Florida, and Miami-Dade County increased significantly from 2019 to 2020 due to the COVID-19 pandemic, but declined from 2020 to year-to date 2021 as the areas began to recover. The assessment area's unemployment rate was below the state's rate in 2019, but above the state's rate in 2020 and year-to-date 2021. The assessment area's unemployment rate was below the national rate in 2019, consistent with the national rate in 2020, and above the national rate in year-to-date 2021.
|
Unemployment Rates |
|||
|
Area |
2019 |
2020 |
2021* |
|
% |
% |
% |
|
|
Miami-Dade County |
2.6 |
8.0 |
6.5 |
|
State of Florida |
3.3 |
7.7 |
5.1 |
|
United States |
3.7 |
8.1 |
5.7 |
|
Source: US. Bureau of Labor Statistics (not seasonal/y adjusted); *As of July 2021 |
|||
Competition
The market is competitive for financial services. According to FDIC Deposit Market Share data as of June 30, 2021, 55 financial institutions operated 614 branches within the assessment area. Of these institutions, IFB ranked 33rd with a deposit market share of 0.4 percent. The three leading financial institutions were Bank of America, NA; Wells Fargo Bank, NA; and JP Morgan Chase Bank, NA, collectively accounting for 37.0 percent of the total deposit market share.
The bank is not required to collect or report its small business loan data, and has not elected to do so. Therefore, the analysis of small business loans under the Lending Test does not include a comparison against aggregate data. However, the 2019 aggregate data shows that 147 lenders reported 128,966 small business loans in the assessment area. This indicates a significant level of competition for this product. The top three lenders were American Express National Bank; JP Morgan Chase Bank, NA; and Bank of America, NA, collectively accounting for 59.9 percent of the total market share.
Significant competition also exists in the assessment area for home mortgage loans among banks, credit unions, and non-depository mortgage lenders. According to 2019 Peer Mortgage Data, 562 HMDA-reportable institutions originated or purchased 58,361 residential mortgage loans in the assessment area. By number of loans, IFB ranked 148th with a market share of 0.08 percent. The top three lenders, by number of loans, included United Shore Financial Service; Wells Fargo Bank, NA; and Quicken Loans, collectively accounting for 16.5 percent of the total market share.
Community Contact
Examiners rely on contacts with community organizations to gain insight regarding the credit needs and economic conditions of a bank's assessment areas. Individuals interviewed provide information based upon their knowledge and expertise in the housing, business, or economic sectors. During this evaluation, examiners conducted a community contact with an organization that serves the assessment area's small businesses. The contact stated that the organization's target market, which includes the bank's assessment area, has more micro and small businesses than the rest of the State of Florida. The vast majority are owned by low- and moderate-income individuals and families that have been underserved by the traditional banking system. The majority of the businesses lack the resources to access the capital needed to grow their businesses. As a result, there is a huge market that is underserved in Miami-Dade County. The contact also stated that in the target market the organization serves, they do not see banks as the source of micro and small business capital. The alternatives for these businesses are non-profit organizations, merchant cash advances, or similar organizations.
Credit and Community Development Needs and Opportunities
Based on demographic information and economic data, examiners identified certain credit and community development needs and opportunities within the assessment area. The high number of low- and moderate-income families, at 24.0 percent and 16.6 percent, respectively, indicates a continued need for affordable housing. Additionally, the high median age of housing stock in low and moderate-income census tracts, at 52 years and 51 years, respectively, indicates a significant need for home improvement loans. Further, a need for loans supporting small businesses is evident based on the community contact's statements coupled with the fact that small businesses comprise a significant majority of the assessment area's businesses.
SCOPE OF EVALUATION - FLORIDA
The evaluation of IFB's performance in the State of Florida considered the bank's operations in the Miami-Miami Beach-Kendall, FL MD assessment area. Examiners conducted a full-scope review of the assessment area. Refer to the overall Scope of Evaluation for additional details.
CONCLUSIONS ON PERFORMANCE CRITERIA IN FLORIDA
LENDING TEST
Overall, IFB demonstrated reasonable performance under the Lending Test. The geographic distribution of loans reflects reasonable dispersion throughout the assessment area. The d1stnbut10n of borrowers reflects, given the demographics of the assessment area, poor penetration among individuals of different income levels and businesses of different sizes.
Geographic Distribution
The geographic distribution of home mortgage and small business loans reflects reasonable dispersion throughout the assessment area.
Home Mortgage Loans
The geographic distribution of home mortgage loans reflects reasonable dispersion throughout the assessment area. As illustrated in the following table, in 2019, the bank's home mortgage lending in low-income census tracts was consistent with aggregate data and the percentage of owner-occupied housing units. In 2020, the bank originated no loans in low-income census tracts; however, lending opportunities in these tracts are limited because of the low percentage of owner-occupied housing units. In 2019 and 2020, the bank's home mortgage lending in moderate-income census tracts was below but comparable to the aggregate data and the percentage of owner-occupied housing units. In 2020, the bank's home mortgage lending in moderate-income census tracts increased from its 2019 performance level.
|
Geographic Distribution of Home Mortgage Loans |
||||||
|
Tract Income Level |
% of Owner- Occupied Housing Units |
Aggregate Performance ¾of# |
# |
% |
$(000s) |
% |
|
Low |
||||||
|
2019 |
2.0 |
1.8 |
1 |
2.0 |
3,075 |
5.7 |
|
2020 |
2.0 |
- |
o |
O.O |
o.o |
o.o |
|
Moderate |
||||||
|
2019 |
21.4 |
18.6 |
7 |
14.3 |
4,246 |
7.9 |
|
2020 |
21.4 |
- |
6 |
16.2 |
4,763 |
13.2 |
|
Middle |
||||||
|
2019 |
31.9 |
31.9 |
4 |
8.2 |
831 |
1.6 |
|
2020 |
31.9 |
- |
3 |
8.1 |
1,892 |
5.3 |
|
Upper |
||||||
|
2019 |
44.4 |
47.0 |
35 |
71.4 |
42,750 |
79.6 |
|
2020 |
44.4 |
- |
22 |
59.5 |
24,567 |
68.2 |
|
Not Available |
||||||
|
2019 |
0.2 |
0.7 |
2 |
4.1 |
2,800 |
5.2 |
|
2020 |
0.2 |
- |
6 |
16.2 |
4,802 |
13.3 |
|
Total |
||||||
|
2019 |
100.0 |
100.0 |
49 |
100.0 |
53,702 |
100.0 |
|
2020 |
100.0 |
100.0 |
37 |
100.0 |
36,024 |
100.0 |
|
Source: 2015 ACS Data; Bank Data; and HMDA Aggregate Data. Due to rounding. totals may not equal 100.0 percent. |
||||||
Small Business Loans
The geographic distribution of small business loans reflects reasonable dispersion throughout the assessment area. As illustrated in the following table, in 2019, the bank's percentage of lending in low-income census tracts exceeded the demographic data. In 2020, the bank originated no loans in low-income census tracts; however, only 3.1 percent of businesses are located in the low-income census tracts, which indicates limited lending opportunities. The bank:'s percentage of lending in moderate-income census tracts in 2019 was comparable to the demographic data. However, in 2020 the bank's percentage of lending in moderate-income census tracts significantly decreased, comparing well below the demographic data.
Examiners attributed the bank's decline in lending to low- and moderate-income census tracts in 2020 to competition and disruptions related to the COVID-19 pandemic. The assessment area has a significant level of competition, with the top three lenders accounting for 59.9 percent of the overall small business loan market share. Although the bank's only branch in the assessment area is located in a moderate-income census tract, the COVID-19 pandemic placed a significant strain on the bank's ability to reach new businesses because the branch was closed for a portion of 2020.
|
Geographic Distribution of Small Business Loans |
|||||||||||
|
Tract Income Level |
1 |
% of Businesses |
1 |
# 1 |
% |
1 |
$(000s) 1 |
% |
|||
|
Low |
|||||||||||
|
2019 |
1 |
3.1 |
1 |
2 1 |
6.5 |
1 |
326 1 |
2.8 |
|||
|
2020 |
1 |
3.1 |
1 |
o 1 |
O.O |
1 |
o 1 |
o.o |
|||
|
Moderate |
|||||||||||
|
2019 |
1 |
21.1 |
1 |
6 1 |
19.4 |
1 |
2,170 1 |
18.3 |
|||
|
2020 |
1 |
20.8 |
1 |
4 1 |
7.8 |
1 |
970 1 |
13.6 |
|||
|
Middle |
|||||||||||
|
2019 |
1 |
26.0 |
1 |
8 1 |
25.8 |
1 |
3,606 1 |
30.4 |
|||
|
2020 |
1 |
25.9 |
1 |
11 1 |
21.6 |
l |
1,655 |
l |
23.1 |
||
|
Upper |
|||||||||||
|
2019 |
1 |
47.4 |
1 |
15 1 |
48.3 |
1 |
5,742 1 |
48.5 |
|||
|
2020 |
1 |
47.8 |
1 |
34 1 |
66.7 |
1 |
4,339 1 |
60.7 |
|||
|
Not Available |
|||||||||||
|
2019 |
1 |
2.4 |
1 |
o 1 |
o.o |
1 |
o 1 |
O.O |
|||
|
2020 |
1 |
2.4 |
1 |
2 1 |
3.9 |
1 |
187 1 |
2.6 |
|||
|
Total |
|||||||||||
|
2019 |
1 |
100.0 |
1 |
31 1 |
100.0 |
1 |
11,844 1 |
100.0 |
|||
|
2020 |
1 |
100.0 |
1 |
51 1 |
100.0 |
1 |
7,151 1 |
100.0 |
|||
|
Source: 2015 ACS Census Data; 2019-2020 D&B Data; and Bank Data. Dueto rounding, totals may not equal 100.0 percent. |
|||||||||||
Borrower Profile
The borrower profile distribution reflects poor penetration among individuals of different income levels and businesses of different sizes.
Home Mortgage Loans
The distribution of borrowers reflects poor penetration among individuals of different income levels. As illustrated in the following table, the bank originated no loans to low- or moderate-income borrowers in 2019 or 2020. Lending opportunities to low-and moderate-income borrowers may be limited given the high poverty rate at 16.9 percent, the low median family income levels for low and moderate-income families, and the high median housing value at $244,010. These families would generally not qualify for a home loan. Nonetheless, the bank's performance is still considered poor given the lack of home mortgage loans originated.
|
Borrower Profile of Home Mortgage Loans |
||||||
|
Borrower Income Level |
% of Families |
Aggregate Performance ¾of# |
# |
% |
$(000s) |
% |
|
Low |
||||||
|
2019 |
24.0 |
1.9 |
o |
o.o |
o |
O.O |
|
2020 |
24.0 |
- |
o |
o.o |
o |
O.O |
|
Moderate |
||||||
|
2019 |
16.6 |
4.9 |
o |
O.O |
o |
o.o |
|
2020 |
16.6 |
- |
o |
O.O |
o |
o.o |
|
Middle |
||||||
|
2019 |
16.9 |
15.4 |
1 |
2.0 |
175 |
0.3 |
|
2020 |
16.9 |
- |
o |
O.O |
o |
O.O |
|
Upper |
||||||
|
2019 |
42.5 |
58.3 |
19 |
38.8 |
27,496 |
51.2 |
|
2020 |
42.5 |
- |
14 |
37.8 |
15,871 |
44.1 |
|
Not Available |
||||||
|
2019 |
O.O |
19.5 |
29 |
59.2 |
26,031 |
48.5 |
|
2020 |
O.O |
- |
23 |
62.2 |
20,153 |
55.9 |
|
Total |
||||||
|
2019 |
100.0 |
100.0 |
49 |
100.0 |
53,702 |
100.0 |
|
2020 |
100.0 |
100.0 |
37 |
100.0 |
36,024 |
100.0 |
|
Source: 2015 ACS Data; Bank Data; and HMDA Aggregate Data. Due to rounding, totals may not equal 100.0 percent. |
||||||
Small Business Loans
The distribution of borrowers reflects poor penetration among businesses of different sizes. As illustrated in the following table, the bank's percentage of loans to businesses with revenues of $1.0 million or less compared well below the demographic data in 2019 and 2020. However, 44 loans in the 2020 sample were SBA PPP loans for which revenue data was not collected. Because revenues were not collected for PPP loans, examiners conducted an analysis of these loans by loan amounts as a proxy for revenues. As illustrated in the second table below, 95.5 percent of the loans were less than $250,000, which demonstrated the bank's willingness to make small business loans.
|
Borrower Profile of Small Business Loans |
|||||||||||
|
Gross Revenue Level |
¾of Businesses |
1 |
# |
1 |
% |
1 |
$(000s) |
1 |
% |
||
|
<=$1,000,000 |
|||||||||||
|
2019 |
92.0 |
1 |
7 |
1 |
22.6 |
1 |
3,038 |
1 |
25.6 |
||
|
2020 |
93.3 |
1 |
1 |
1 |
2.0 |
1 |
150 |
1 |
2.1 |
||
|
>1,000,000 |
|||||||||||
|
2019 |
1 |
3.5 |
1 |
22 |
1 |
71.0 |
1 |
8,666 |
1 |
73.2 |
|
|
2020 |
2.7 |
1 |
6 |
1 |
11.8 |
1 |
3,948 |
1 |
55.2 |
||
|
Revenue Not Available |
|||||||||||
|
2019 |
1 |
4.5 |
1 |
2 |
1 |
6.4 |
1 |
140 |
1 |
1.2 |
|
|
2020 |
4.0 |
1 |
44 |
1 |
86.2 |
1 |
3,053 |
1 |
42.7 |
||
|
Total |
|||||||||||
|
2019 |
100.0 |
1 |
31 |
1 |
100.0 |
1 |
11,844 |
1 |
100.0 |
||
|
2020 |
100.0 |
1 |
51 |
1 |
100.0 |
1 |
7,151 |
1 |
100.0 |
||
|
Source: 2019-2020 D&B Data and Bank Data. Due to rounding, totals may not equal 100.0 percent. |
|||||||||||
|
Distribution of PPP Loans by Loan Size |
||||||||
|
Loan Size |
# |
1 % |
1 |
$(000s) |
1 % |
|||
|
<$100,000 |
||||||||
|
2020 |
1 |
34 |
1 77.3 |
1 |
1,099 |
1 36.0 |
||
|
$100,000 - $249,000 |
||||||||
|
2020 |
8 |
1 18.2 |
1 |
1,279 |
1 41.9 |
|||
|
$250,000 - $1,000,000 |
||||||||
|
2020 |
1 |
2 |
1 4.5 |
1 |
675 |
1 22.1 |
||
|
Total |
||||||||
|
2020 |
44 |
1 100.0 |
1 |
3,053 |
1 100.0 |
|||
|
Source: 2020 Bank Data. Due to rounding, totals may not equal 100.0 percent. |
||||||||
COMMUNITY DEVELOPMENT TEST
The bank's community development performance demonstrates adequate responsiveness to the community development needs in its assessment area. The bank met these needs through community development loans, qualified investments, and community development services.
Community Development Loans
IFB originated 18 community development loans totaling $34.7 million during the evaluation period in the assessment area. This amount represents 48.6 percent by number and 92.9 percent by dollar volume of the total community development loans in the bank:'s assessment areas. The hank's lending by number is higher, and by dollar amount is significantly higher, than the previous evaluation. Regarding the community development purpose, 14 loans totaling $17.0 million support affordable housing, one loan totaling $12.6 million supports economic development, and three loans totaling $5.1 million support stabilization and revitalization. An example of a community development loan includes a $12.6 million loan to a business to acquire a Hispanic food distribution company located in a low-income census tract that is also a qualified Opportunity Zone. Opportunity Zones are an economic tool to spur economic growth and job creation in low-income communities. The loan proceeds were used to assist with job retention for low- and moderate income employees. Another example of a community development loan includes the renewal of a
$3.5 million loan to a business for improvements and maintenance of two apartment buildings
located in a moderate-income census tract that is also a qualified low-income housing census tract (LIHCT) defined by the US Census Bureau, in which at least 50 percent of households have incomes less than 60 percent of the area median gross income.
Qualified Investments
IFB made 12 qualified investments totaling $3.2 million in the assessment area. The bank's number of investments, including donations, is slightly lower by number, but higher by dollar amount, than the previous evaluation. Regarding the community development purpose, five investments totaling
$1.4 million supported affordable housing and seven investments totaling $1.8 million supported economic development. The qualified investments include the bank's investment in five CRA Qualified Investment Funds earmarked for properties in the assessment area, totaling $1.4 million. The funds are issued by Fannie Mae and Ginnie Mae and secured by affordable housing restricted to low- and moderate-income individuals. Prior to the last evaluation, IFB made a $249,000 deposit in a local minority-owned financial institution. The deposit renews every 90 days and remains outstanding. During the current evaluation period, the bank: made $250,000 deposits into two
separate local minority-owned financial institutions. These deposits renew every 12 months and remain outstanding. All three institutions have been designated through the U.S. Department of Treasury as minority-owned financial institutions based on ownership interest.
IFB made 13 qualified donations totaling $33,906 in the assessment area. Regarding the community development purpose, one donation totaling $1,000 supported affordable housing, 11 donations totaling $27,906 supported community services, and one donation totaling $5,000 supported economic development. As an example, in 2019 and 2020, the bank made two donations for a total of $3,500 to an organization's scholarship program that provides needs-based scholarships to low- and moderate-income Hispanic students. Additionally, during the review period, the bank made a donation totaling $5,000 to an organization that provides financial coaching and education to low- to moderate-income individuals.
Community Development Services
Employees provided 22 community development services in the assessment area. The bank's performance is comparable to the previous evaluation. Regarding the community development purpose, 19 services supported organizations that provide essential community services to low- and moderate-income individuals, and three services supported organizations that focus on economic development initiatives. As an example, since 2019, a bank officer has served on the Board and Finance and Audit Committees of an economic development organization. The organization advances economic development through the creation and administration of loan programs and technical assistance programs for minority-owned small businesses, as well as educational programs and scholarships for low- and moderate-income minority individuals. Another bank officer has served on the Board and Finance Committee of a community service organization that provides early learning services to low-income families, including child care resources, referral services, subsidized child care assistance, and financial assistance for early child education.
STATE OF NEW YORK
CRA RATING FOR NEW YORK: NEEDS TO IMPROVE
The Lending Test is rated: Needs to improve
The Community Development Test is rated: Satisfactory
DESCRIPTION OF INSTITUTION'S OPERATIONS IN NEW YORK
IFB operates one of its two full-service branches in the New York-Jersey City-White Plains, NY NJ MD assessment area (State of New York). The assessment area includes all 2,057 census tracts in Bronx, Kings, New York, and Queens counties, New York, which comprise a portion of the New York-Jersey City-White Plains, NY-NJ MD. The assessment area is new since the previous evaluation.
Economic and Demographic Data
The following table illustrates select demographic characteristics of the assessment area based on the 2015 ACS Census data and the 2020 D&B data.
|
Demographic lnformation of the Assessment Area |
||||||
|
Demographic Characteristics |
# |
Low % of # |
Moderate % of# |
Middle % of # |
Upper % of # |
NA* % of # |
|
Geographies (Census Tracts) |
2,057 |
13.9 |
27.3 |
29.8 |
25.9 |
3.1 |
|
Population by Geography |
7,954,262 |
17.6 |
30.3 |
26.2 |
25.6 |
0.3 |
|
Housing Units by Geography |
3,244,089 |
15.6 |
27.5 |
24.8 |
31.8 |
0.3 |
|
Owner-Occupied Units by Geography |
877,350 |
4.0 |
18.1 |
34.2 |
43.5 |
0.2 |
|
Occupied Rental Units by Geography |
2,070,401 |
21.1 |
31.9 |
21.3 |
25.3 |
0.3 |
|
Vacant Units by Geography |
296,338 |
11.2 |
24.5 |
21.5 |
42.4 |
0.4 |
|
Businesses by Geography |
794,884 |
8.9 |
21.3 |
20.5 |
46.4 |
2.9 |
|
Farms by Geography |
3,114 |
6.3 |
17.4 |
21.7 |
52.7 |
1.8 |
|
Family Distribution by Income Level |
1,742,525 |
33.5 |
16.5 |
15.6 |
34.5 |
O.O |
|
Household Distribution by Income Level |
2,947,751 |
32.6 |
14.8 |
15.3 |
37.3 |
o.o |
|
Median Family Income MSA - 35614 New York-Jersey City-White Plains, NY-NJ |
$67,560 |
Median Housing Value |
$541,839 |
|||
|
Median Gross Rent |
$1,347 |
|||||
|
Families Below Poverty Level |
18.0% |
|||||
|
Source: 2015 ACS Census and 2020 D&B data Due to rounding, totals may not equal 1OO.0% (*) The NA category consists of geographies that have not been assigned an income classification. |
||||||
The Geographic Distribution criterion compares home mortgage loans to the distribution of owner occupied housing units and small business loans to the percentage of businesses located in low-,
moderate-, middle-, and upper-income census tracts. As illustrated in the previous table, only 4.0 percent of owner-occupied housing units and 8.9 percent of businesses are located in low-income census tracts. This data indicates limited owner-occupied home mortgage and small business lending opportunities in low-income census tracts. Further, 18.0 percent of families have incomes below the federal poverty level, which poses a challenge for home mortgage lending to low-income families, as these families likely face difficulty in qualifying for a home mortgage loan.
Examiners used FFIEC-updated median family income figures to analyze home mortgage lending under the Borrower Profile criterion. The following table reflects low-, moderate-, middle-, and upper-income categories in the assessment area.
|
Median Family Income Ranges |
||||
|
Median Family Incomes |
Low <50% |
Moderate 50% to <80% |
Middle 80% to <120% |
Upper 2:120% |
|
2019 ($79,300) |
<$39,650 |
$39,650 to <$63,440 |
$63,440 to <$95,160 |
2:$95,160 |
|
2020 ($81,800) |
<$40,900 |
$40,900 to <$65,440 |
$65,440 to <$98,160 |
2':$98,160 |
|
Source: FFIEC |
||||
The analysis of small business loans under the Borrower Profile criterion compares the distribution of businesses by gross annual revenue level. According to 2020 D&B data, 794,884 businesses operated in the assessment area. Of these businesses, 90.9 percent had gross annual revenues of $1.0 million or less, 4.4 percent had gross annual revenues of more than $1.0 million, and 4.7 percent of businesses <lid not report revenues.
According to Moody's Analytics, the assessment area's largest industries include education and health services at 22.4 percent, professional and business services at 16.6 percent, and financial services at 9.5 percent. Moody's Analytics reports that the assessment area's major employers include Montefiore Health System (32,232 employees), Mount Sinai Health System (32,074 employees), and JP Morgan Chase Bank, NA (29,000 employees).
Data obtained from the U.S. Bureau of Labor Statistics indicates significant changes in the unemployment rate during the evaluation period. As illustrated in the following table, the unemployment rate in the United States, New York, and all four counties increased significantly from 2019 to 2020 because of the COVID-19 pandemic, but declined from 2020 to year-to-date 2021 as the areas began to recover. Besides Bronx County, the assessment area's unemployment rate was below or consistent with the state's rate in 2019. All of the counties' unemployment rates were consistent with or exceeded the state's rate in 2020 and year-to-date 2021. The assessment area's unemployment rate was above the national rate in 2020 and year-to-date 2021. Overall, the unemployment rate is highest in Bronx County and lowest in New York County.
|
Unemployment Rates |
|||
|
Area |
2019 |
2020 |
2021* |
|
% |
% |
% |
|
|
Bronx County |
5.3 |
16.0 |
13.9 |
|
Kings County |
4.0 |
12.5 |
10.5 |
|
New York County |
3.4 |
9.5 |
7.8 |
|
Queens County |
3.4 |
12.5 |
9.9 |
|
State ofNew York |
3.8 |
10.0 |
7.4 |
|
United States |
3.7 |
8.1 |
5.7 |
|
Source: U.S. Bureau of Labor Statistics (not seasonally adjusted); *As of Ju/y 2021 |
|||
Competition
The market is highly competitive for financial services. According to FDIC Deposit Market Share data, as of June 30, 2021, 110 financial institutions operated 1,462 branches within the assessment area. Of these institutions, IFB ranked 88th with a deposit market share of 0.01 percent.
Collectively accounting for 62.5 percent of the total deposit market share, the three leading financial institutions were JP Morgan Chase Bank, NA; Goldman Sachs Bank USA; and The Bank of New York Mellon.
The bank is not required to collect or report its small business loan data, and has not elected to do so. Therefore, the analysis of small business loans under the Lending Test does not include comparisons against aggregate data. However, the 2019 aggregate data shows that 212 lenders reported 267,353 small business loans in the assessment area. This indicates a significant level of competition for this product. Collectively accounting for 69.9 percent of the total market share, the top three lenders were American Express National Bank; JP Morgan Chase Bank, NA; and Bank of America, NA.
The bank did not originate any home mortgage loans in the assessment area in 2019, as it was a new assessment area. However, the 2019 aggregate data shows that 382 lenders reported 72,226 home mortgage loans in the assessment area. This indicates a significant level of competition for this product. Collectively accounting for 29.9 percent of the total market share, the top three lenders were JP Morgan Chase Bank, NA; Wells Fargo Bank, NA; and Citibank, NA.
Credit and Community Development Needs and Opportunities
Based on demographic information and economic data, examiners identified certain credit and community development needs and opportunities within the assessment area. The high number of low-income families, at 33.5 percent, indicates a continuing need for affordable housing.
Additionally, the high median age of housing stock in low- and moderate-income census tracts, at 70 years and 72 years, respectively, indicates a significant need for home improvement loans.
Further, a need for loans supporting small businesses is evident, as small businesses comprise a significant majority of the assessment area's businesses.
SCOPE OF EVALUATION -NEW YORK
The evaluation of IFB's performance in the State of New York considered the bank's operations in the New York-Jersey City-White Plains, NY-NJ MD assessment area. Examiners conducted a full scope review of the assessment area. Refer to the overall Scope of Evaluation for additional details.
CONCLUSIONS ON PERFORMANCE CRITERIA IN NEW YORK
LENDING TEST
Overall, examiners could not form reasonable conclusions regarding the bank's geographic distribution of loans and distribution of borrowers among individuals of different income levels and businesses of different sizes because of the low volume of home mortgage and small business loans originated in this assessment area.
Geographic Distribution
Given the low volume of home mortgage and small business loans originated in this assessment area, examiners could not form reasonable conclusions regarding the bank's performance.
Home Mortgage Loans
The bank originated no home mortgage loans in the assessment area in 2019. In 2020, the bank originated one loan totaling $576,000 in an upper-income census tract of the assessment area.
Small Business Loans
The bank originated no small business loans in the assessment area in 2019. In the sample of 2020 small business loans reviewed, all six loans originated in the assessment area were PPP loans, including one loan totaling $53,500 in a moderate-income census tract, two loans totaling $51,000 in a middle-income census tract, one loan totaling $38,400 in an upper-income census tract, and two loans totaling $125,600 in census tracts without a revenue level designation.
Borrower Profile
Given the low volume of home mortgage and small business loans originated in this assessment area, examiners could not form reasonable conclusions regarding the bank's performance.
Home Mortgage Loans
The bank originated no home mortgage loans in the assessment area in 2019. In 2020, the bank originated one home mortgage loan totaling $576,000 loan upper-income borrower.
Small Business Loans
The bank originated no small business loans in the assessment area in 2019. In the sample of 2020 small business loans reviewed, all six loans originated in the assessment area were PPP loans for which revenue data was not collected.
COMMUNITY DEVELOPMENT TEST
The bank's community development performance demonstrates adequate responsiveness to the community development needs in its assessment area, considering the institution's capacity and the need an availability of such opportunities for community development in the institution's assessment area. The bank met these needs through community development loans, qualified investments, and community development services.
Community Development Loans
IFB originated 11 community development loans and purchased eight community development loans totaling $2.6 million during the evaluation period in the assessment area. This amount represents
51.4 percent by number and 7.1 percent by dollar volume of the total community development loans in the bank's assessment areas. Regarding the community development purpose, all 11 originated loans totaling $755,150 support the stabilization of moderate-income census tracts by retaining existing businesses and employees during the national COVID-19 pandemic. Examples include a loan totaling $102,800 to an automotive repair business to assist with retaining 30 employees and a loan totaling $44,300 to a packaged frozen food wholesaler to assist with retaining four employees. The eight purchased community development loans, totaling $1.9 million, support affordable housing. Examples include two loans, totaling $320,122, for the refinance of two primary residences located in low-income census tracts to a low-income borrower and moderate-income borrower. Additional examples include six loans, totaling $1.3 million, for the refinance of six primary residences located in moderate-income census tracts to moderate-income borrowers.
Oualified Investments
IFB made seven qualified investments totaling $1.1 million during the evaluation period in the assessment area, all of which supported affordable housing. The qualified investments include the bank's investment in four CRA Qualified Investment Funds earmarked for properties in the assessment area totaling $392,000. The funds are issued by Fannie Mae and Ginnie Mae and secured by affordable housing restricted to low- and moderate-income individuals. Additionally, three qualified investments included the bank's investment in New York City Housing Development Corporation revenue bonds totaling $700,000 to finance affordable housing for low income seniors and other individuals.
IFB made two qualified donations totaling $7,500 in the assessment area, both of which supported community services. The qualified donations benefitted two organizations which provide community services to students of low- and moderate-income families. Specifically, the bank made a donation for a total of $2,500 to an organization to support financial literacy programs to students of low- and moderate-income families. Additionally, the bank made a donation totaling $5,000 to an organization that provides school supplies, computers, I-pads, broadband access, and college scholarship funds to students of low-income families.
Community Development Services
IFB provided one community development service during the evaluation period in the assessment area. Bank staff provided financial literacy training as part of a community service organization's financial literacy program offered to students in a school where the majority of students are economically disadvantaged and eligible for free or reduced lunches.
APPENDICES
INTERMEDIATE SMALL BANK PERFORMANCE CRITERIA
Lending Test
The Lending Test evaluates the bank's record of helping to meet the credit needs of its assessment area(s) by considering the following criteria:
- The bank's loan-to-deposit ratio, adjusted for seasonal variation, and, as appropriate, other lending-related activities, such as loan originations for sale to the secondary markets, community development loans, or qualified investments;
- The percentage of loans, and as appropriate, other lending-related activities located in the bank's assessment area(s);
- The geographic distribution of the bank's loans;
- The bank's record of lending to and, as appropriate, engaging in other lending-related activities for borrowers of different income levels and businesses and farms of different sizes; and
- The bank's record of taking action, if warranted, in response to written complaints about its performance in helping to meet credit needs in its assessment area(s).
Community Development Test
The Community Development Test considers the following criteria:
- The number and amount of community development loans;
- The number and amount of qualified investments;
- The extent to which the bank provides community development services; and
- The bank's responsiveness through such activities to community development lending, investment, and service needs.
SUMMARY OF RATINGS FOR RATED AREAS
|
Rated Area |
Lending Test |
Community Development Test |
Rating |
|
Florida |
Satisfactory |
Satisfactory |
Satisfactory |
|
New York |
Needs to Improve |
Satisfactory |
Needs to Improve |
GLOSSARY
Aggregate Lending: The number of loans originated and purchased by all reporting lenders in specified income categories as a percentage of the aggregate number of loans originated and purchased by all reporting lenders in the metropolitan area/assessment area.
American Community Survey (ACS): A nationwide United States Census survey that produces demographic, social, housing, and economic estimates in the form of five year estimates based on population thresholds.
Area Median Income: The median family income for the MSA, if a person or geography is located in an MSA; or the statewide nonmetropolitan median family income, if a person or geography is located outside an MSA.
Assessment Area: A geographic area delineated by the bank under the requirements of the Community Reinvestment Act.
Census Tract: A small, relatively permanent statistical subdivision of a county or equivalent entity. The primary purpose of census tracts is to provide a stable set of geographic units for the presentation of statistical data. Census tracts generally have a population size between 1,200 and 8,000 people, with an optimum size of 4,000 people. Census tract boundaries generally follow visible and identifiable features, but they may follow nonvisible legal boundaries in some instances. State and county boundaries always are census tract boundaries.
Combined Statistical Area (CSA): A combination of several adjacent metropolitan statistical areas or micropolitan statistical areas or a mix of the two, which are linked by economic ties.
Community Development: For loans, investments, and services to qualify as community development activities, their primary purpose must:
- Support affordable housing for low- and moderate-income individuals;
- Target community services toward low- and moderate-income individuals;
- Promote economic development by financing small businesses or farms; or
- Provide activities that revitalize or stabilize low- and moderate-income geographies, designated disaster areas, or distressed or underserved nonmetropolitan middle-income geographies.
Community Development Corporation (CDC): A CDC allows banks and holding companies to make equity type of investments in community development projects. Bank CDCs can develop innovative debt instruments or provide near-equity investments tailored to the development needs of the community. Bank CDCs are also tailored to their financial and marketing needs. A CDC may purchase, own, rehabilitate, construct, manage, and sell real property. Also, it may make equity or debt investments in development projects and in local businesses. The CDC activities are expected to directly benefit low- and moderate-income groups, and the investment dollars should not represent an undue risk on the banking organization.
Community Development Financia} lnstitutions (CDFis): CDFls are private intermediaries (either for profit or nonprofit) with community development as their primary mission. A CDFI facilitates the flow of lending and investment capital into distressed communities and to individuals who have been unable to take advantage of the services offered by traditional financial institutions. Some basic types of CDFIs include community development banks, community development loan funds, community development credit unions, micro enterprise funds, and community development venture capital funds.
A certified CDFI must meet eligibility requirements. These requirements include the following:
- Having a primary mission of promoting community development;
- Serving an investment area or target population;
- Providing development services;
- Maintaining accountability to residents of its investment area or targeted population through representation on its governing board of directors, or by other means;
- Not constituting an agency or instrumentality of the United States, of any state or political subdivision of a state.
Community Development Loan: A loan that:
- Has as its primary purpose community development; and
- Except in the case of a wholesale or limited purpose bank:
- Has not been reported or collected by the bank or an affiliate for consideration in the bank's assessment area as a home mortgage, small business, small farm, or consumer loan, unless it is a multifamily dwelling loan (as described in Appendix A to Part 203 of this title); and
- Benefits the bank's assessment area(s) or a broader statewide or regional area including the bank's assessment area(s).
Community Development Service: A service that:
- Has as its primary purpose community development;
- Is related to the provision of financial services; and
- Has not been considered in the evaluation of the bank's retail banking services under § 345.24(d).
Consumer Loan(s): A loan(s) to one or more individuals for household, family, or other personal expenditures. A consumer loan does not include a home mortgage, small business, or small farm loan. This definition includes the following categories: motor vehicle loans, credit card loans, home equity loans, other secured consumer loans, and other unsecured consumer loans.
Core Based Statistical Area (CBSA): The county or counties or equivalent entities associated with at least one core (urbanized area or urban cluster) of at least 10,000 population, plus adjacent counties having a high degree of social and economic integration with the core as measured through commuting ties with the counties associated with the core. Metropolitan and Micropolitan Statistical Areas are the two categories of CBSAs.
Distressed Middle-Income Nonmetropolitan Geographies: A nonmetropolitan middle-income geography will be designated as distressed if it is in a county that meets one or more of the following triggers:
- An unemployment rate of at least 1.5 times the national average;
- A poverty rate of 20 percent or more; or
- A population loss of 10 percent or more between the previous and most recent decennial census or a net migration loss of 5 percent or more over the 5-year period preceding the most recent census.
Family: Includes a householder and one or more other persons living in the same household who are related to the householder by birth, marriage, or adoption. The number of family households always equals the number of families; however, a family household may also include·non-relatives living with the family. Families are classified by type as either a married-couple family or other family. Other family is further classified into "male householder" (a family with a male householder and no wife present) or "female householder" (a family with a female householder and no husband present).
FFIEC-Estimated Income Data: The Federal Financial Institutions Examination Council (FFIEC) issues annual estimates which update median family income from the metropolitan and nonmetropolitan areas. The FFIEC uses American Community Survey data and factors in information from other sources to arrive at an annual estimate that more closely reflects current economic conditions.
Full-Scope Review: A full-scope review is accomplished when examiners complete all applicable interagency examination procedures for an assessment area. Performance under applicable tests is analyzed considering performance context, quantitative factors (e.g., geographic distribution, borrower profile, and total number and dollar amount of investments), and qualitative factors (e.g., innovativeness, complexity, and responsiveness).
Geography: A census tract delineated by the United States Bureau of the Census in the most recent decennial census.
Home Mortgage Disclosure Act (HMDA): The statute that requires certain mortgage lenders that do business or have banking offices in a metropolitan statistical area to file annual summary reports of their mortgage lending activity. The reports include such data as the race, gender, and the income of applicants; the amount of loan requested; and the disposition of the application (approved, denied, and withdrawn).
Home Mortgage Loans: Includes closed-end mortgage loans or open-end line of credits as defined in the HMDA regulation that are not an excluded transaction per the HMDA regulation.
Housing Unit: Includes a house, an apartment, a mobile home, a group of rooms, or a single room that is occupied as separate living quarters.
Limited-Scope Review: A limited-scope review is accomplished when examiners do not complete all applicable interagency examination procedures for an assessment area.
Performance under applicable tests is often analyzed using only quantitative factors (e.g., geographic distribution, borrower profile, total number and dollar amount of investments, and branch distribution).
Low-Income: Individual income that is less than 50 percent of the area median income, or a median family income that is less than 50 percent in the case of a geography.
Low Income Housing Tax Credit: The Low-Income Housing Tax Credit Program is a housing program contained within the Internal Revenue Code of 1986, as amended. It is administered by the U.S. Department of the Treasury and the Internal Revenue Service. The U.S. Treasury Department distributes low-income housing tax credits to housing credit agencies through the Internal Revenue Service. The housing agencies allocate tax credits on a competitive basis.
Developers who acquire, rehabilitate, or construct low-income rental housing may keep their tax credits. Or, they may sell them to corporations or investor groups, who, as owners of these properties, will be able to reduce their own federal tax payments. The credit can be claimed annually for ten consecutive years. Por a project to be eligible, the developer must set aside a specific percentage of units for occupancy by low-income residents. The set-aside requirement remains throughout the compliance period, usually 30 years.
Market Share: The number of loans originated and purchased by the institution as a percentage of the aggregate number of loans originated and purchased by all reporting lenders in the metropolitan area/assessment area
Median Income: The median income divides the income distribution into two equal parts, one having incomes above the median and other having incomes below the median.
Metropolitan Division (MD): A county or group of counties within a CBSA that contain(s) an urbanized area with a population of at least 2.5 million. A MD is one or more main/secondary counties representing an employment center or centers, plus adjacent counties associated with the main/secondary county or counties through commuting ties.
Metropolitan Statistical Area (MSA): CBSA associated with at least one urbanized area having a population of at least 50,000. The MSA comprises the central county or counties or equivalent entities containing the core, plus adjacent outlying counties having a high degree of social and economic integration with the central county or counties as measured through commuting.
Middle-lncome: Individual income that is at least 80 percent and less than 120 percent of the area median income, or a median family income that is at least 80 and less than 120 percent in the case of a geography.
Moderate-Income: Individual income that is at least 50 percent and less than 80 percent of the area median income, or a median family income that is at least 50 and less than 80 percent in the case of a geography.
Multi-family: Refers to a residential structure that contains five or more units.
Nonmetropolitan Area (also known as non-MSA): All areas outside of metropolitan areas. The definition of nonmetropolitan area is not consistent with the definition of rural areas. Urban and rural classifications cut across the other hierarchies. For example, there is generally urban and rural territory within metropolitan and nonmetropolitan areas.
Owner-Occupied Units: Includes units occupied by the owner or co-owner, even if the unit has not been fully paid for or is mortgaged.
Qualified Investment: A lawful investment, deposit, membership share, or grant that has as its primary purpose community development.
Rated Area: A rated area is a state or multistate metropolitan area. For an institution with domestic branches in only one state, the institution's CRA rating would be the state rating. If an institution maintains domestic branches in more than one state, the institution will receive a rating for each state in which those branches are located. If an institution maintains domestic branches in two or more states within a multistate metropolitan area, the institution will receive a rating for the multistate metropolitan area.
Rural Area: Territories, populations, and housing units that are not classified as urban.
Small Business lnvcstmcnt Company (SDIC): SBICs are privately-owned investment companies which are licensed and regulated by the Small Business Administration (SBA). SBICs provide long-term loans and/or venture capital to small firms. Because money for venture or risk investments is difficult for small firms to obtain, SBA provides assistance to SBICs to stimulate and supplement the flow of private equity and long-term loan funds to small companies. Venture capitalists participate in the SBIC program to supplement their own private capital with funds borrowed at favorable rates through SBA's guarantee of SBIC debentures. These SBIC debentures are then sold to private investors. An SBIC's success is linked to the growth and profitability of the companies that it finances. Therefore, some SBICs primarily assist businesses with significant growth potential, such as new firms in innovative industries. SBICs finance small firms by providing straight loans and/or equity-type investments. This kind of financing gives them partial ownership of those businesses and the possibility of sharing in the companies' profits as they grow and prosper.
Small Business Loan: A loan included in "loans to small businesses" as defined in the Consolidated Report of Condition and Income (Call Report). These loans have original amounts of
$1 million or less and are either secured by nonfarm nonresidential properties or are classified as commercial and industrial loans.
Small Farm Loan: A loan included in "loans to small farms" as defined in the instructions for preparation of the Consolidated Report of Condition and Income (Call Report). These loans have original amounts of $500,000 or less and are either secured by farmland, including farm residential and other improvements, or are classified as loans to finance agricultural production and other loans to farmers.
Underserved Middle-Income Nonmetropolitan Geographies: A nonmetropolitan middle income geography will be designated as underserved if it meets criteria for population size, density, and dispersion indicating the area's population is sufficiently small, thin, and distant from a population center that the tract is likely to have difficulty financing the fixed costs of meeting essential community needs.
Upper-Income: Individual income that is 120 percent or more of the area median income, or a median family income that is 120 percent or more in the case of a geography.
Urban Area: All territories, populations, and housing units in urbanized areas and in places of 2,500 or more persons outside urbanized areas. More specifically, "urban" consists of territory, persons, and housing units in places of 2,500 or more persons incorporated as cities, villages, boroughs (except in Alaska and New York), and towns (except in the New England states, New York, and Wisconsin).
"Urban" excludes the rural portions of"extended cities"; census designated place of 2,500 or more persons; and other territory, incorporated or unincorporated, including in urbanized areas.
